Sanders and Warren Would Each More than Double the Size of the Federal Government
It’s January, and Election Season is in full swing. There are many remarkable aspects to the 2020 Presidential Race. Lost in the shuffle of impeachment news, the DNC nominating horserace and the latest juvenile presidential tweets, is the sheer size and scope of the expansive spending proposals of both Senators Sanders and Warren.
When you lay it all out in total, it’s breathtaking. The American voting public deserves to know more about its scale, and I don’t think very many do have a sense of the scale that’s being proposed.
How well do you know the scale?
Try this quick quiz (no Googling just yet!):
- What is the approximate amount of money the United States spends on the military per year? It’s a large sum, right? What percentage do you think it represents of overall federal spending? If we zeroed out all that spending and redirected it toward the Sanders or Warren proposals, how many times over do you think it might pay for the things they’re promising? How much would be left over if we just zeroed out everything we spend on the military?
- The population of the United States is about 325 million. Roughly how many people work for the federal government today? If the Warren or Sanders plans were enacted, roughly how many people would have their paychecks dependent upon the government? Have you thought much about the fact that these employees and agencies and regulations and policies, once shifted to federal control, will be subject to the whims of any future administration which follows? Are Washington DC resource allocators and decisionmakers widely popular? In your experience, have they generally done a better job allocating resources than more local control?
- When you add up all federal spending in a given year, approximately what percentage is it of our Gross Domestic Product? How might the percentage change with the Sanders or Warren plans?
OK, let’s dive in.
Each candidate has published plans which would more than double the size of the US Federal Government as measured by spending. Each would eliminate the private health insurance industry, an industry that employs about a million Americans. Each have pledged to ban fracking, a technology which has contributed enormously to United States GDP growth over the past decade and turned us into a net exporter of fossil fuels, greatly improving our strategic position vis-a-vis oil rich nations.
The US federal government employs about 4 million Americans today, if you include military and civilians.
Other than a significant, understandable blip during WWII, the US federal spending has been remarkably consistent at around 16% to 20% of GDP:
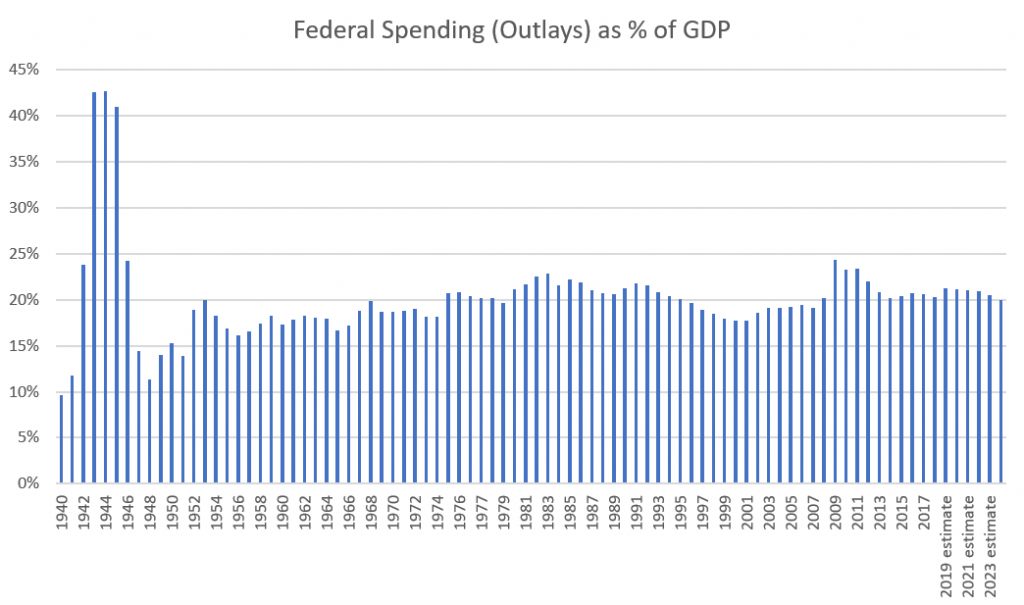
Yet in out years, each of the Warren and Sanders plans would consume a conservative 50-70% of the United States’ annual GDP. That’s not just WWII-level federal influence in the economy — that’s roughly twice the level of federal influence in the overall economy that we had during World War II.
For reference, US GDP came in around $19 trillion in 2017. And a very good argument can be mustered with little effort that the enormous tax burden each candidate would like to introduce on everything from financial transactions to owned property (wealth) would cause capital flight, reduce innovation and investment, putting a big drain on the collective economic output of this nation.
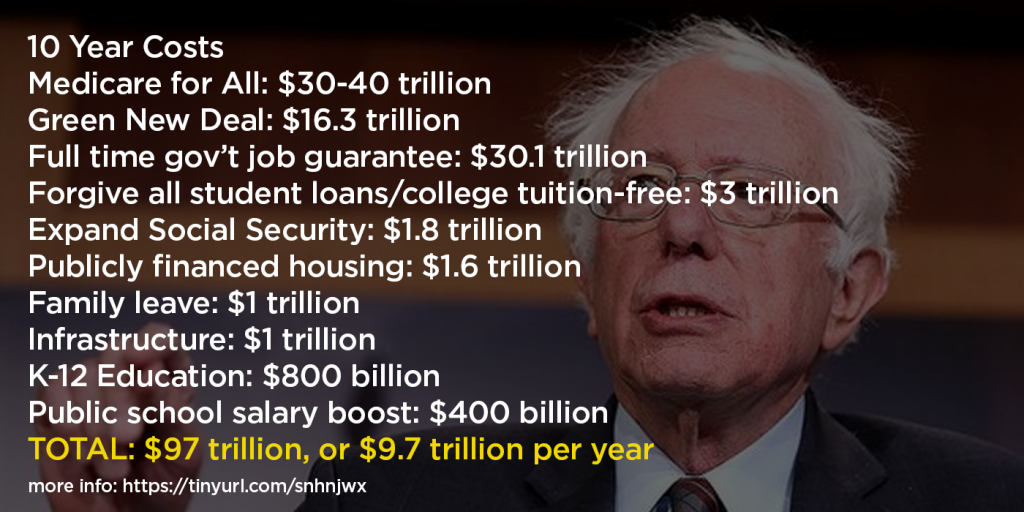
Sanders’ Plans
- Medicare for All Plan: $30-40 trillion over a 10 year period
- Green New Deal Climate Plan: $16.3 trillion
- Guarantee to all Americans a full-time job paying $15/hr and full benefits: $30.1 trillion
- Forgive all student loans and guarantee public-college tuition: $3 trillion
- Expand Social Security: $1.8 trillion
- Publicly financed housing: $1.6 trillion
- Family leave: $1 trillion
- Infrastructure: $1 trillion
- K-12 Education: $800 billion
- Public school teach salary boost: $400 billion
The 10-Year Total: $97 trillion, or about $9.7 trillion per year in additional federal spending in 2021 terms.
The entire US military budget in 2019 was about $989 billion (per year.) You could zero out all US military spending and it would only pay for about 10% of Bernie Sanders’ proposed spending.
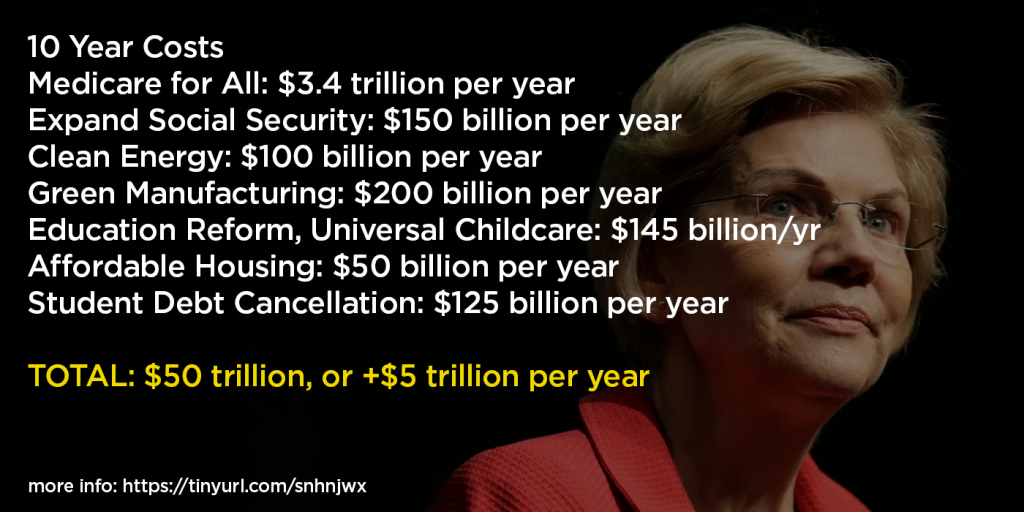
Warren’s Plans
- Medicare for All: $3.4 trillion per year
- Expand Social Security: $150 billion per year
- Clean Energy: $100 billion per year
- Green Manufacturing: $200 billion per year
- Education Reform, Universal Childcare: $145 billion per year
- Affordable Housing: $50 billion per year
- Student Debt Cancellation: $125 billion per year
The ten year total: Approximately $50 trillion over 10 years, inflation adjusted, or about $4.2 trillion per year additional spending in 2021 terms.
How Does It Compare To Current Spending?
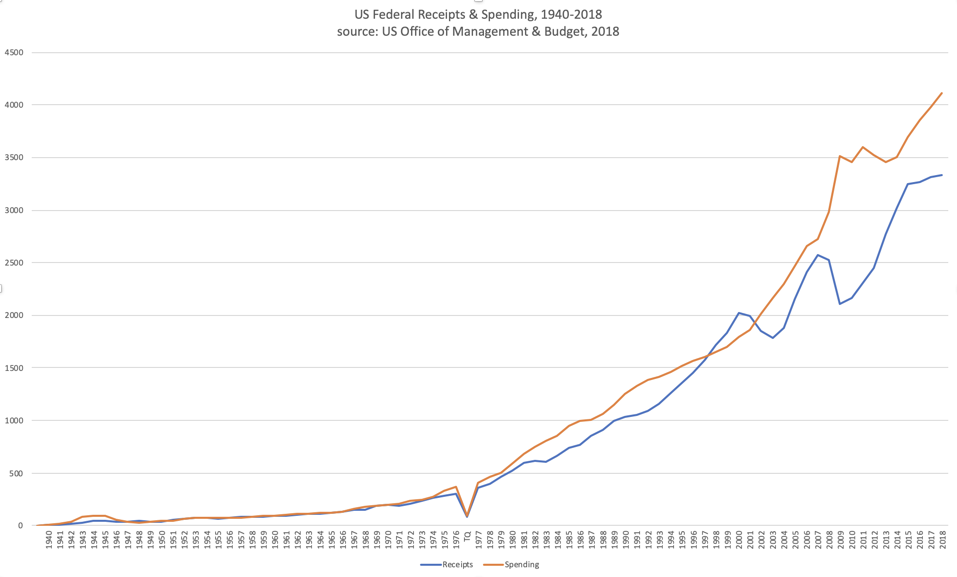
If you head on over to the Office of Management and Budget, you can download Federal Outlays and Receipts.
Charting it, with the axis on the vertical in $billions, you can see that US federal outlays exceed our revenue, and spending is around $4.3 trillion per year. You can also see that we had a nice period during the Clinton Administration (and Gingrich Congress) where we had surpluses — we spent less than we brought in. Since about 2008, federal revenues have been increasing, but started to slow down their rate of growth around 2016, when the corporate tax rate was slashed.
In the hypothetical case where Warren and Sanders each had their plans approved, the charts would look approximately like this:
Bernie Sanders Spending Impact
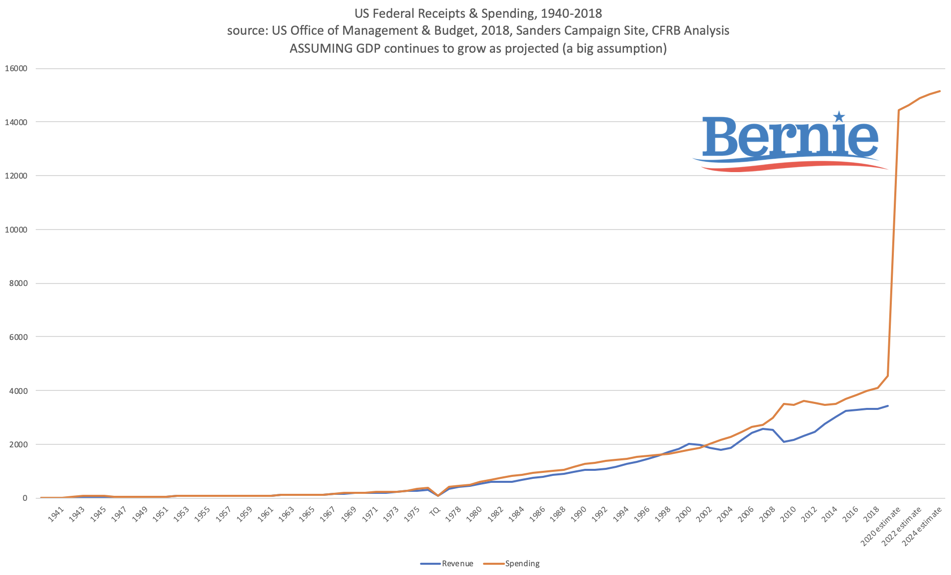
I am deliberately not forecasting the blue line, revenue, because it’s very questionable what would happen to that line. In theory, with tax hikes on everything from financial transactions to middle class wage-earners (to help pay for his Medicare for All plan), tax revenues would grow substantially.
But it’s also hard to model what would happen to GDP; it’s very plausible that GDP would have a significant drag on it with the disruption to industries, elimination of fracking, elimination of the private health insurance industry, taxing many financial transactions and more. Not only are wealth taxes clearly unconstitutional, in European nations where they’ve been enacted, they’ve often been repealed or scaled back dramatically, because they have led to capital and headquarters flight.
Sanders’ startling 10-year $97+ trillion spending plans are comprised mostly of Medicare for All, Green New Deal spending and a proposal to guarantee all Americans a full time job (presumably paid for by government mandate, if necessary) paying minimum wage. It is remarkable that, while he’s also planning to forgive all student loans(!) and make every public university tuition free, that these sums are so “small”, relatively speaking, as to not even make it into his Top 3 Most Expensive Ideas.
Elizabeth Warren Spending Impact
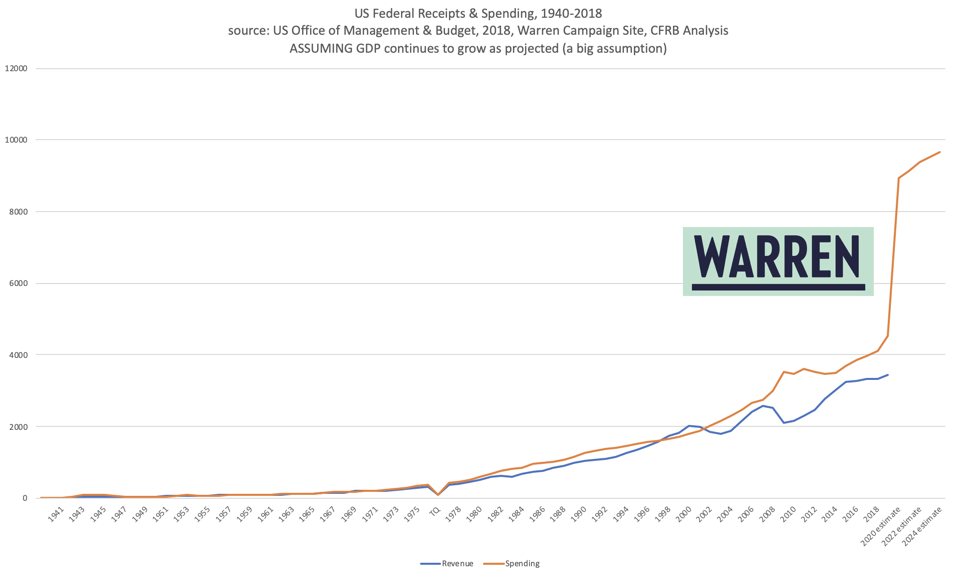
The biggest chunk of Warren’s spending is her Medicare for All plan, the single-payer healthcare plan which she’s like to see enacted. Her plan to pay for it includes wealth taxes, and also “recapture” of the fees that corporations pay to subsidize health plans for employees. Do unions yet fully understand that what Warren is proposing is to eliminate their “Cadillac” healthcare plans, essentially telling their employers to send that money instead to Washington DC to allocate to healthcare providers?
Other issues for both Senators Warren and Sanders are the clear unconstitutionality of their Wealth Tax plan.
Deficit as Percentage of GDP
Here’s a chart of the Deficit as a Percentage of GDP. Source is from the Office of Management and Budget website, historical tables.
The average is 3.1%. Standard deviation (excluding unusual WWII period) is about 2.5%, which means that about 69% of the time, Deficit as a % of GDP falls within the range of 0.6% surplus and 5.6%, and this is (still) one of those times. But agree very much that this is the time to “save” for a rainy day.
What if we confiscate the wealth of the top 1% of households?
Sanders often cites the huge disparities in wealth between the richest 1% of Americans and all other households. And it’s true, the total wealth of the top 1% of American households is approximately $29 trillion.
That’s a huge sum.
But let’s go a step further here: where is most of that wealth? It’s not in stacks of cash, nor is it a bank account anywhere. The vast majority of that wealth is in shares of publicly traded (and some private) companies that founders and founding families own. But most founders don’t own 100% of their companies. In fact at this writing, even Jeff Bezos “only” owns about 4% of Amazon.com.
So who are the other 96% of the shareholders of Amazon? The other owners of these shares and other stocks are, either directly or indirectly, the 55% of American households that own stocks, which includes working families, teachers pensions, corporate 401(k)’s, union and municipal retirement funds, and global investors who think America’s a decent place to invest.
So let’s imagine we got past the clear unconstitutionality of a wealth tax, and, just to get a sense of the scale here, confiscated not just some, but 100% of the wealth of America’s richest households.
First, to get it, the stocks would need to be sold en masse.
And thus, you have to look at the devastating impact this action would have on the securities they hold. For instance, imagine Jeff Bezos being forced to sell all his Amazon shares. What’s that going to do to Amazon stock? Down by 20, 30, 40, 50%? The drop comes both from far more sellers than buyers, and the market’s conclusion that Bezos has “less of an interest” in Amazon.
Let’s continue with this thought experiment, and generously posit an unrealistic guess that this would only result in a 30% drop in the equity value as $29 trillion in starting market value is being liquidated.
You’re left with 70% of $29 trillion, or about $20 trillion (generous estimate) going to the federal government to serve central resource allocation. Confiscating 100% of the richest American’s owned wealth, in other words, even assuming it were constitutional, is not even enough to pay for three years of Sanders’ economic agenda. After those three years are up, funds to support it don’t appear by magic. All the wealth of the top 1% has been confiscated. What happens then? We turn to the 90-99%. But that’s only enough for another few months. Then the 70-90%. Then the 50-70%… and everyone.
Further, all this assumes, very incorrectly, that there wouldn’t be major negative impacts on GDP. To see this, simply ask yourself what happens to capital formation and investment to build new companies and jobs in such a world, where property is subject to seizure. Would there be capital flight?
Further, to get less than three years of the Sanders agenda, every American who holds stocks (55% of American households) receives a major haircut on their holdings, whether they be in 401(k)’s or retirement plans.
Historic Trends in Federal Spending Per Capita
What the federal government spends, per-capita, has been growing well beyond inflation since about 1952. The grey line below is an inflation-adjusted chart of federal spending per capita. (This particular chart ends with 2011 data; I’ll be pulling together more recent data shortly, but the trend and order of magnitude should be clear.)
A fully-enacted Sanders agenda would add another $29,000 to this chart (i.e., triple the per-capita levels of federal spending today.) A fully-enacted Warren agenda would roughly double the federal per-capita spending shown in this chart.
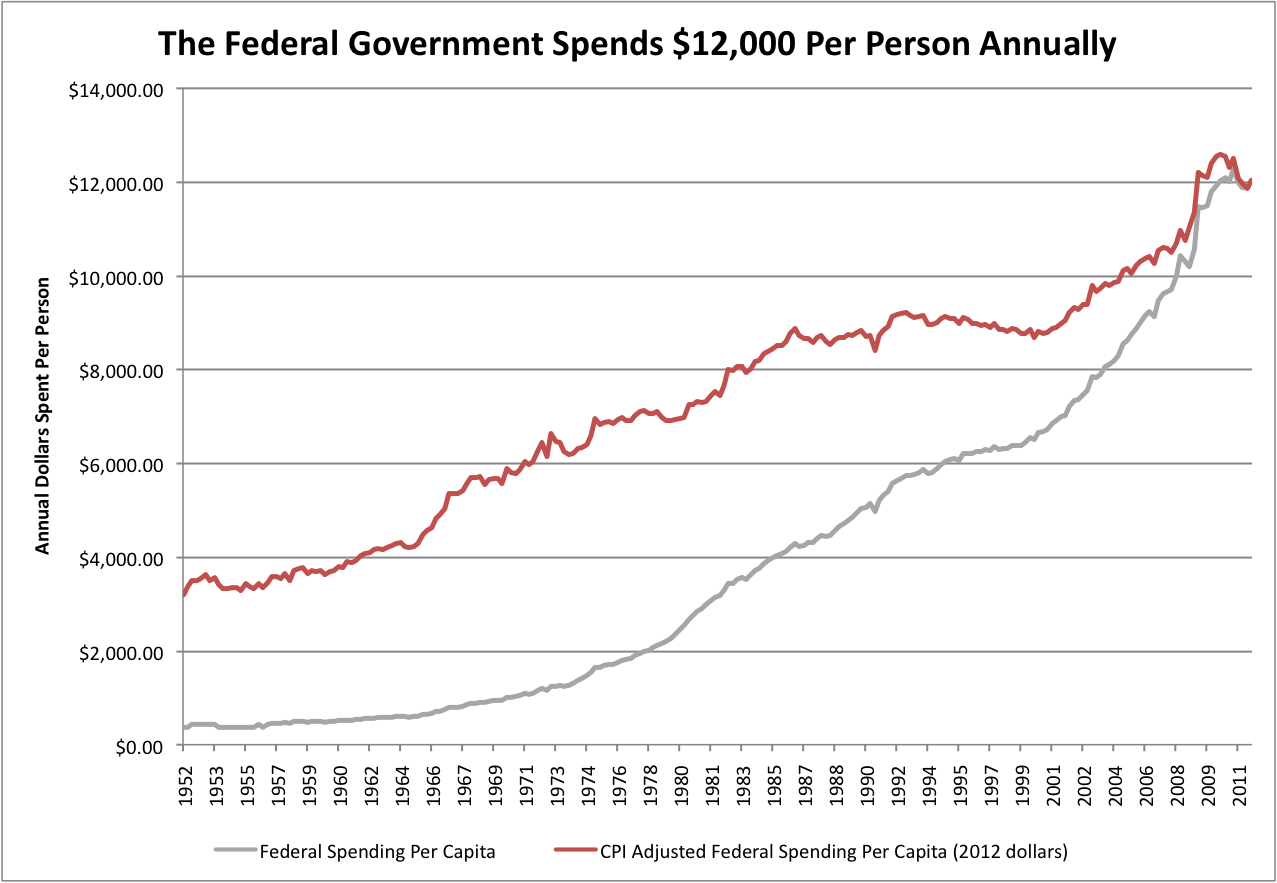
Source: Office of Management and Budget Historical Tables, Consumer Price Index
How Well Does Sanders Know The Cost of His Plans?
“I can’t rattle off to you every nickel and every dime.”
Conclusion
Sanders and Warren’s federal spending agenda is strikingly large. These plans are not just incremental changes in how we envision the relationship of the federal government to our economy, it would be a truly staggering change.
While I personally don’t support this ratcheting up of federal spending and control, I am still a fan of the representative democracy we have. So if this is what we as a society truly want and vote for, so be it.
But here’s the thing. We should know what we’re voting for. Do you really? Did any of the information above surprise you?
Based on anecdotal polling of even the most intelligent, well-read friends and relatives I’ve asked, I think too little understanding actually exists in most voters’ minds about the scale of what is actually being proposed, and what it might mean for the change in federal control over our economy, impacts on GDP, hard-fought union “platinum” healthcare plans, entire industries which employ millions, the equity values for the 54% of American households that own stocks, a staggering level of debt we would pass along to future generations, and more.
Next time you meet a fellow voter, you might want to ask them to imagine zeroing out all the dollars we spend on the US military — every bomb, aircraft carrier and soldier salary, then ask them how much of a Sanders agenda it might pay for, and how much might be left over. You’ll probably be surprised at the answer; I’d be surprised if most Americans get the right answer within even a multiple of 10x.
References
[1] “The Unaffordable Candidate“, October 15, 2019, City Journal
[2] “The Staggering Cost of Elizabeth Warren’s Plans: $4.2 trillion per year“, October 24, 2019, Yahoo Finance
[3] “Plans“, Elizabeth Warren Campaign Website
[4] “Issues“, Bernie Sanders Campaign Website
[5] “The cost of Sanders’ agenda would set a peacetime US record“, CNN, January 14, 2020
[6] “Medicare for All Would Cost $32.6 Trillion Over 10 Years, Study Says“, Bloomberg July 29, 2018
[7] “New analysis finds Sanders’s plans would add $19 trillion to debt,” The Hill, May 2016
[8] “The High Cost of Warren and Sanders’ Single Payer Plans“, The Atlantic Magazine, October 2019